
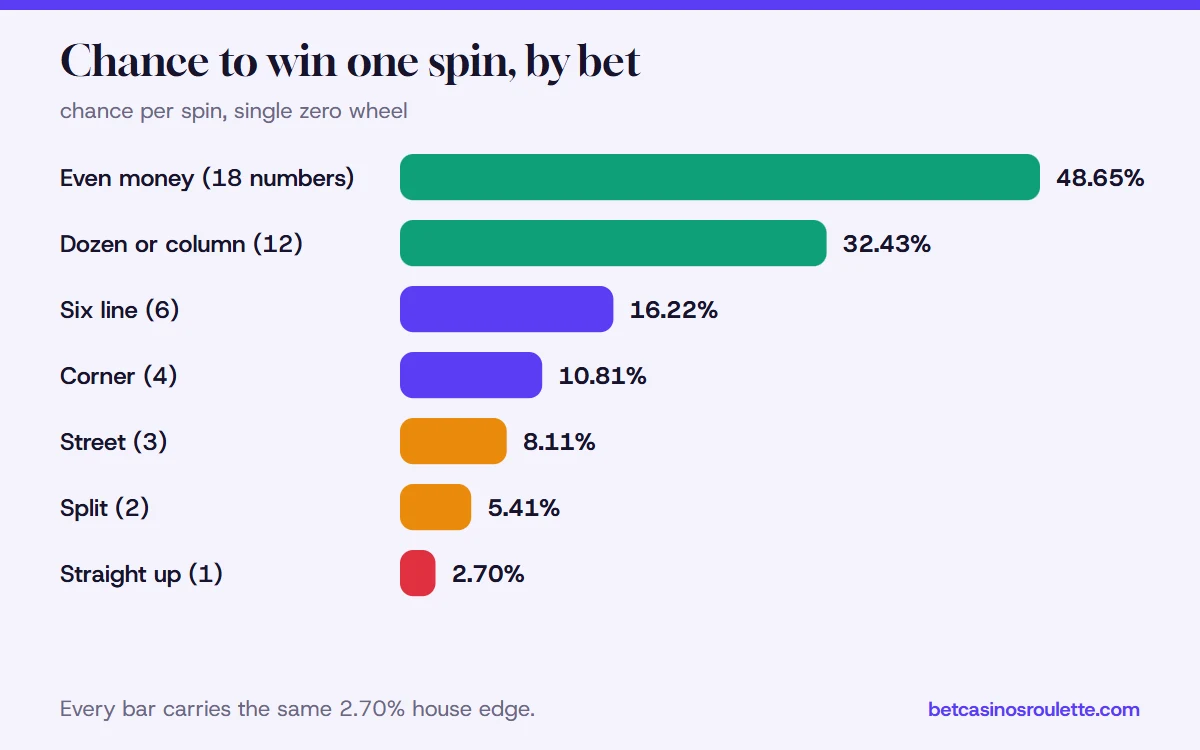
This roulette strategy chart puts every bet and every popular betting system on one page, with coverage, payout, chance of winning, how wild the swings are, and the result each one really produces over time. The short version is in the last column of every table: the casino keeps about 2.70% on a single zero wheel and 5.26% on a double zero wheel, whatever you do.
The charts are built to print or screenshot. Keep them on your phone for a casino trip or next to you while you practice with play credits.
At the table
Lowest edge
About 1.35%: even money bets on a French table with la partage or en prison.Highest edge
7.89% on the American five number bet; 7.69% on triple zero wheels.Most likely win
Even money bets: 48.65% per spin with one zero.Biggest payout
Straight up: 35 to 1, a 2.70% chance with one zero.Systems tested
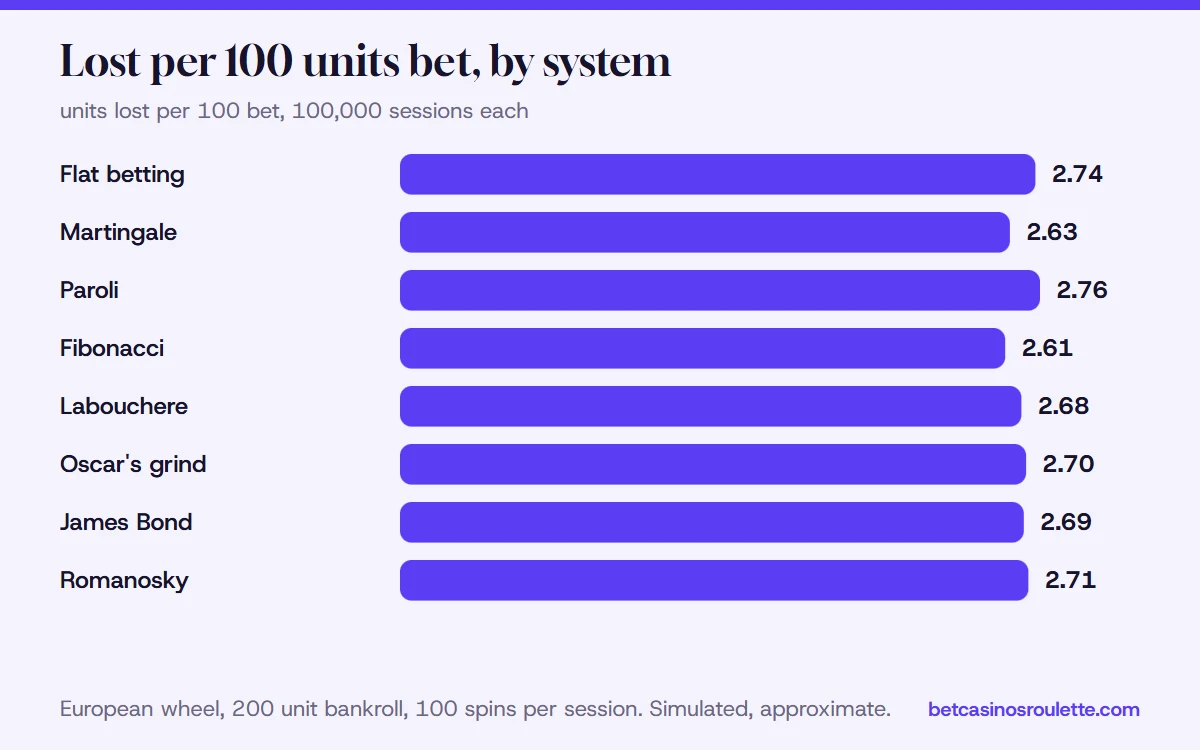
Nine, 100,000 sessions each. Each gave up 2.61 to 2.76 per 100 units wagered.
Roulette strategy chart for every bet on the table
Start with the bets themselves. Coverage drives everything: wide chips hit often and pay little, narrow chips hit rarely and pay a lot. "Swing" is how far your results bounce around from spin to spin, not how much you lose on average.
| Bet | Pays | Numbers | Hit rate, one green | Hit rate, two greens | Swing |
|---|---|---|---|---|---|
| Straight up | 35 to 1 | one | 2.70% | 2.63% | Very high |
| Split | 17 to 1 | two | 5.41% | 5.26% | High |
| Street or trio | 11 to 1 | three | 8.11% | 7.89% | High |
| Corner, also first four | 8 to 1 | four | 10.81% | 10.53% | Medium high |
| Top line, double zero only | 6 to 1 | five | none | 13.16% | Medium high |
| Six line | 5 to 1 | six | 16.22% | 15.79% | Medium |
| Dozen or column | 2 to 1 | twelve | 32.43% | 31.58% | Low medium |
| Color, parity, half | 1 to 1 | eighteen | 48.65% | 47.37% | Low |
Note that the house edge column is missing on purpose. Every row shares it on a given wheel (2.70% or 5.26%), and only the five number spot on American tables breaks ranks, at 7.89%. The full guide to roulette bets shows where each chip goes, and the payouts page works through examples.
Roulette wheel strategy chart: which table to choose
The wheel matters more than any bet or system, because it sets the edge on everything. This is the one decision that really changes your long-run result.
| Wheel and rule | Green pockets | Units kept from every 100 bet | Edge |
|---|---|---|---|
| French table, color and parity bets | one | 1.35 | near 1.35% |
| European | one | 2.70 | 2.70% |
| Atlantic City surrender, color and parity bets | two | 2.63 | 2.63% |
| American | two | 5.26 | 5.26% |
| American, five number spot | two | 7.89 | 7.89% |
| Triple zero | three | 7.69 | 7.69% |
Read the bottom rows as warnings. A triple zero wheel takes almost three times as much as a single zero wheel from the same bets. Each version has its own guide: single zero, double zero and three zeros.
Roulette system chart: how each progression moves
Betting systems are rules for changing your bet size. Here is how the common ones react to a win or a loss and where each one breaks.
| System | Usual bet | Losing spin | Winning spin | Run ends when | Main danger |
|---|---|---|---|---|---|
| Flat betting | Any | Same bet | Same bet | You stop | Slow, steady edge |
| Martingale | Even money | Double | Back to base | One win (plus 1 base) | Table max or bankroll after a streak |
| Reverse Martingale | Even money | Back to base | Double | A loss | Gives back all streak profit |
| Paroli | Even money | Back to base | Double | 3 wins banked or a loss | Many small losses |
| Fibonacci | Even money | One step up | Two steps back | Back at the start | Bets climb fast: 34, 55, 89 |
| D'Alembert | Even money | Add 1 unit | Take 1 unit off | You stop | Slow climb into large bets |
| Labouchere | Even money | Add lost amount to line | Cross off first and last | Line cleared | Line grows, bets hit the max |
| Oscar's grind | Even money | Same bet | Up 1 unit while behind | 1 unit profit | Long losing series |
Each linked system has its own page with worked runs. The betting systems guide compares them in plain words, and the roulette strategy hub ties everything together.
Roulette betting strategy chart: tested over 100,000 sessions each
To fill in the honest last column, I simulated every system on the same terms: a European wheel, a 200 unit bankroll, a 1 unit base bet on red, a table maximum of 100 units and 100 spins per session. When a progression called for more than the maximum or the bankroll, the run restarted at the base bet. The two spreads used their normal 20 and 8 unit rounds. Results are approximate.
| System | Sessions ahead | Went broke | Average result | Average total bet | Lost per 100 bet |
|---|---|---|---|---|---|
| Flat, 1 unit on red | 35.3% | 0.0% | minus 2.7 | 100 | 2.74 |
| Martingale | 63.3% | 2.0% | minus 9.3 | 352 | 2.63 |
| Paroli | 38.0% | 0.0% | minus 4.7 | 169 | 2.76 |
| Fibonacci | 81.1% | 0.6% | minus 6.8 | 262 | 2.61 |
| D'Alembert | 58.7% | 4.9% | minus 16.3 | 595 | 2.75 |
| Labouchere (1, 2, 3, 4) | 49.4% | 7.8% | minus 27.7 | 1,034 | 2.68 |
| Oscar's grind | 71.9% | 1.5% | minus 8.4 | 312 | 2.70 |
| James Bond (20 per spin) | 34.7% | 27.5% | minus 48.2 | 1,794 | 2.69 |
| Romanosky (8 per spin) | 28.4% | 0.0% | minus 21.7 | 800 | 2.71 |
Look at the columns side by side. Fibonacci finished ahead in 81.1% of sessions, flat betting in only 35.3%, yet Fibonacci lost more on average. Its rare bad sessions were far deeper. The final column barely moves: every system surrendered somewhere from 2.61 to 2.76 units per 100 wagered, the 2.70% edge wearing a little luck.
Roulette table strategy chart for the two famous spreads
Spreads put several bets down at once and keep them the same every spin. These two come up most often.
| James Bond | Romanosky | |
|---|---|---|
| Chips per spin | 20 units | 8 units |
| Placement | 14 high, 5 on the 13 to 18 six line, 1 on 0 | two dozens at 3 apiece, two corners at 1 apiece inside the open dozen |
| Numbers covered | 25 | 32 |
| Hit chance, single zero | 67.57% | 86.49% |
| When it hits | plus 8, plus 10 or plus 16 | plus 1 |
| When it misses | minus 20 | minus 8 |
| Average loss per spin, single zero | about 0.54 units | about 0.22 units |
| Long-run result | minus 2.70% of all bets | minus 2.70% of all bets |
Both feel safer than they are. A high hit rate is paid for with a loss that is several times the usual win. The full breakdowns, with the result for every number, are on the James Bond strategy and Romanosky pages.
How to read and use this chart
- Pick the wheel first from Chart 2. Single zero, ideally with French rules.
- Pick a bet for the ride you want from Chart 1. Low swing for a long session, high swing if you want a shot at a big hit.
- Pick a bet size around one fortieth of the session stake. The small bankroll guide shows how much longer small bets last.
- Treat any system in Chart 3 as a way to shape the ride, not to win. Chart 4 shows why.
- Write a stop loss and an end time on your phone first, then honor the earlier one.
The bottom line of every chart
Every row on this page points to the same truth. Bets differ in how often they win and how much they pay. Systems differ in when they raise and lower bets. Wheels differ in the edge. Only the last one changes how much you lose over time.
- Best value: even money bets on a French table, about 1.35%.
- Fair standard: any bet on a single zero wheel, 2.70%.
- Avoid: double zero if you have a choice, and the five number bet and triple zero wheels always.
If you came here looking for a chart that wins, the honest answer is on how to beat roulette: none exists, but you can choose the cheapest way to play.
Questions players ask
What is a roulette strategy chart?
It is a one page summary of the bets, wheels and betting systems, with each one's coverage, payout, chance of winning, risk and long-run result. It speeds up choosing a bet and a table; no chart moves a single pocket's probability.
Which roulette system has the best odds?
None. Every system places ordinary bets, so the house edge stays 2.70% with one green pocket. Across 100,000 computer sessions apiece, the nine systems all ended 2.61 to 2.76 units down per 100 wagered.
What is the best bet on a roulette strategy chart?
On a standard wheel every bet has the same edge. Cheapest of all is red or black at a French table that refunds half on zero, near 1.35%. Dearest is the five number spot on American felt, 7.89%.
Why do some systems win most sessions but still lose overall?
Systems that raise bets after losses win small amounts often, then lose a large amount when a streak goes against them. Fibonacci finished ahead in 81.1% of simulated sessions yet lost more on average than flat betting.
Does a roulette wheel strategy chart change between European and American tables?
Yes. The chances drop slightly on an American wheel because of the extra 00, and the casino's share nearly doubles, 5.26% against 2.70%. The payouts stay the same.
Can I print this roulette system chart?
Yes. The tables are plain and fit a phone screen or a printed page. Use them for free play practice and as a quick reference.